

Greetings,
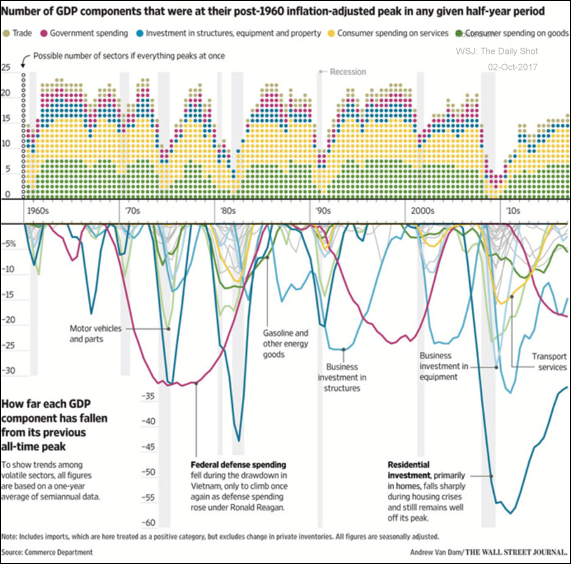
The United States: This chart shows the number of the GDP components which were at peak level in each 6-month period. It’s an interesting way to see what’s driving growth.

Credit: This chart shows the middle-market loan volume by purpose (use of proceeds).

Canada: Here is an interesting chart from the Economist showing migration to Canada from various regions.

Emerging Markets: EM assets don’t always struggle during the Fed’s tightening cycles.

The Eurozone: This infographic shows the usefulness of a Eurozone-wide debt issuance. It reduces the dangerous financial links between each nation’s government and its banking system. However, fiscal discipline enforcement will be even more critical to control moral hazards.

Equity Markets: The US vs. the rest of the world fund flows divergence continues.

Food for Thought: Political affiliations of every NFL team’s fans.

Edited by Joseph N Cohen
To receive the Daily Shot Premium, you need to be a subscriber to The Wall Street Journal. The Daily Shot readers qualify for a special membership offer of $1 for 2 months and can join simply by clicking here.
If you are already a WSJ member, you can sign up for The Daily Shot at our Email Center by clicking here.
The Daily Shot Premium is also available online at DailyShotWSJ.com
If you have any issues at all, please contact a Customer Service representative by calling 1-800-JOURNAL (1-800-568-7625) or sending an email to support@wsj.com.
Thanks to Josh Marte (@joshdigga), Matt Garrett (@MattGarrett3), Joseph Cohen (@josephncohen), Ycharts.com, S&P Global, and Moody’s Investors Service for helping with the research for the Daily Shot.
We would also like to thank the Federal Reserve Bank of St. Louis for the incredible job they have done providing data and graphics to the public. Here is the credit and legal notice related to all FRED charts: FRED® Graphs ©Federal Reserve Bank of St. Louis. All rights reserved. All FRED® Graphs appear courtesy of Federal Reserve Bank of St. Louis. http://research.stlouisfed.org/fred2/
Contact the Daily Shot Editor: Editor@DailyShotLetter.com