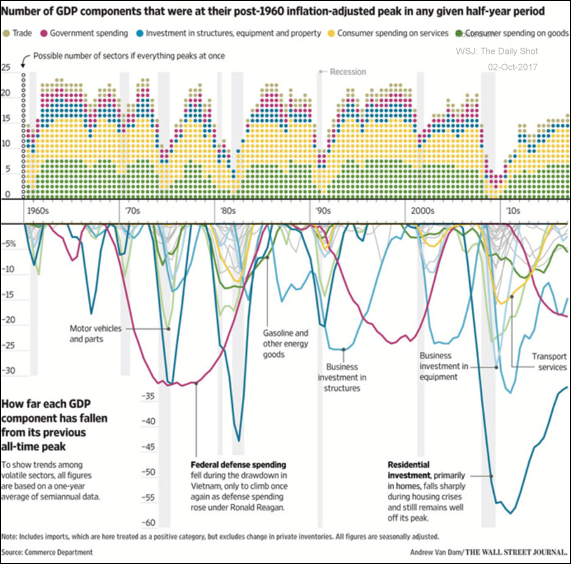

Greetings, The United States: This chart shows the number of the GDP components which were at peak level in each 6-month period. It’s an interesting way to see what’s driving growth. Credit: This chart shows the middle-market loan volume by purpose (use of proceeds). Canada: Here is an interesting chart from the …
The Daily Shot Brief – October 2nd, 2017