

Greetings,
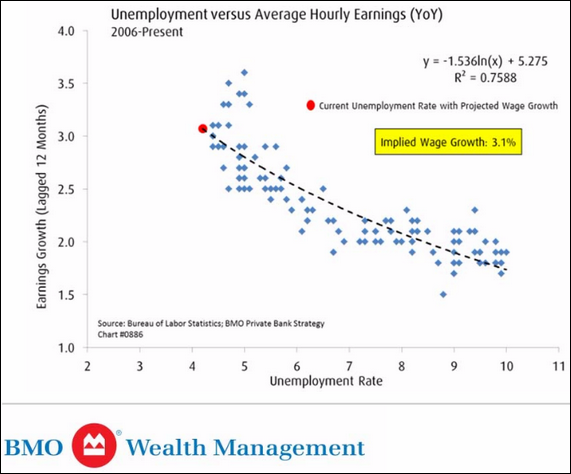
The United States:This version of the Phillips Curve is forecasting wages to be growing at over 3% annually a year from now.

The Eurozone: This chart compares the French composite output subindex (both manufacturing and services) with the nation’s GDP growth.

Emerging Markets: Here is the JPMorgan Emerging Market Currency Index.

Equity Markets: This chart compares the dividend yield with the “buyback yield” going back to 1871.

Credit: High-yield spreads have diverged from a corporate bank lending index shown below (loan demand minus tightening lending standards).

Rates: How did the Treasury curve behave during the previous Fed tightening cycles?

Global Developments: This chart shows the fiscal/monetary policy changes for major economies over the past three months (Argentina needs to be moved back into the “tightening” square).

Food for Thought: Traffic changes at top news sites over the past year (they forgot the WSJ).

Edited by Joseph N Cohen
To receive the Daily Shot Premium, you need to be a subscriber to The Wall Street Journal. The Daily Shot readers qualify for a special membership offer of $1 for 2 months and can join simply by clicking here.
If you are already a WSJ member, you can sign up for The Daily Shot at our Email Center by clicking here.
The Daily Shot Premium is also available online at DailyShotWSJ.com
If you have any issues at all, please contact a Customer Service representative by calling 1-800-JOURNAL (1-800-568-7625) or sending an email to support@wsj.com.
Thanks to Josh Marte (@joshdigga), Matt Garrett (@MattGarrett3), Joseph Cohen (@josephncohen), Ycharts.com, S&P Global, and Moody’s Investors Service for helping with the research for the Daily Shot.
We would also like to thank the Federal Reserve Bank of St. Louis for the incredible job they have done providing data and graphics to the public. Here is the credit and legal notice related to all FRED charts: FRED® Graphs ©Federal Reserve Bank of St. Louis. All rights reserved. All FRED® Graphs appear courtesy of Federal Reserve Bank of St. Louis. http://research.stlouisfed.org/fred2/
Contact the Daily Shot Editor: Editor@DailyShotLetter.com